Ingen varer
Informationsvisualisering
Visning: Type : Alle | Sprog : Alle | Format : Alle
-
Bemærk: Kan leveres før jul.
Python for Data Analysis 3e: Data Wrangling with pandas, NumPy, and Jupyter (Bog, Paperback / softback, Engelsk)Updated for Python 3.10 and pandas 1.4, the third edition of this hands-on guide is packed with practical case studies that show you how to solve a broad set of data analysis problems effectively.
Levering: 6 - 9 hverdage -
Bemærk: Kan leveres før jul.
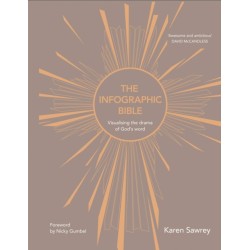
The Infographic Bible (Bog, Hardback, Engelsk)Ancient scriptures from the most popular book of all time, revolutionised to reveal its themes and narratives for a modern generation.
Levering: 6 - 9 hverdage -
Bemærk: Kan leveres før jul.
Calling Bullshit: The Art of Scepticism in a Data-Driven World (Bog, Paperback / softback, Engelsk)Levering: 6 - 9 hverdage -
Bemærk: Kan leveres før jul.
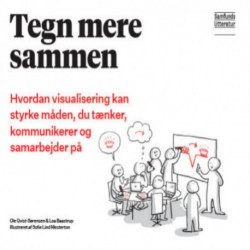
Tegn mere sammen: Hvordan visualisering kan styrke måden du tænker, kommunikerer og samarbejder på (Bog, Paperback, Dansk)Hvorfor skal vi tegne mere sammen? Mange organisationer oplever et behov for nye arbejdsmetoder til at... Læs mere
Levering: 2 - 5 hverdage -
Bemærk: Kan leveres før jul.
-
Bemærk: Kan leveres før jul.
Learning Microsoft Power Bi: Transforming Data Into Insights (Bog, Paperback / softback, Engelsk)This streamlined intro to Microsoft Power BI covers all the foundational aspects and features you need to go from "zero to hero" with data and visualizations.
Levering: 6 - 9 hverdage -
Bemærk: Kan leveres før jul.
-
Bemærk: Kan ikke garanteres før jul. Se dato på varen.
Human-Centred Scientific Data Visualisation: Making Complex Data Accessible for Everyone (Bog, Paperback / softback, Engelsk)Covering a wide range of chart types—including line plots, bar charts, box plots, scatterplots, histograms, pie... Læs mere
Levering: Kan forudbestilles (Forventes d. 15-01-2026) -
Bemærk: Kan ikke leveres før jul.
Data Visualization with Category Theory and Geometry: With a Critical Analysis and Refinement of UMAP (Bog, Hardback, Engelsk)Levering: Skaffevare (forvent 14 - 30 hverdage) -
Bemærk: Kan ikke leveres før jul.
Educational Innovation Through Technology: 13th International Conference, EITT 2024, Macau, China, November 8–10, 2024, Proceedings (Bog, Paperback / softback, Engelsk)color: rgb(34, 34, 34);">3th International Conference of Educational... Læs mere
Levering: Skaffevare (forvent 14 - 30 hverdage) -
Bemærk: Kan ikke leveres før jul.
Narrative SQL: Crafting Data Analysis Queries That Tell Stories (Bog, Paperback / softback, Engelsk)Levering: Skaffevare (forvent 14 - 30 hverdage) -
Bemærk: Kan ikke leveres før jul.
Elemente der Codierungstheorie: Besser sehen, besser horen, besser informieren (Bog, Paperback / softback, Tysk)Levering: Skaffevare (forvent 14 - 30 hverdage)


